Summary
- EU-BDS
- EU NATURE RESTORATION PLAN
- Restoring marine ecosystems
- Target 15
- Subtarget 15.1
- Indicator 15.1.1
Proportion of fish stocks sustainably exploited
- Links
- KCBD API Source Provider API
- Other policies
- CFP SDG
Documentation
Indicator: Proportion of fish stocks sustainably exploited
Tag: env_bio5
Definition: Percentage of fish stocks evaluated using a full analytical stock assessment method and for which the estimated fishing mortality (F) is inferior or equal to the fishing pressure that gives the maximum sustainable yield in the long term (Fmsy)
Unit: % of fish stocks sustainably exploited
Spatial coverage: EU waters including North-East Atlantic and adjacent seas (FAO area 27) and the Mediterranean and Black Sea region (FAO area 37)
Time coverage: 2020
Update frequency: Every year
DPSIR: State
Other policies:
Method: 1) Run a benchmark assessment for the stocks of interest to identify a model to perform stock assessment and set the parameters. Derive the reference point for (among others) the fishing pressure that gives the maximum sustainable yield in the long term (Fmsy) . Work is carried out by a dedicated Expert Working Group for each stock at either the International Council for the Exploration of the Sea (ICES) / Scientific, Technical and Economic Committee for Fisheries (STECF) / General Fisheries Commission for the Mediterranean (GFCM) 2) Run the benchmarked stock assessment model annually for each stock. Work is carried out by Expert Working Groups in charge at either ICES / STECF / GFCM. 3) Publish stock assessment outputs including fishing mortality in scientific reports. 3) Export estimated fishing mortalities (F) from ICES / STECF / GFCM databases 4) Compare estimated F outputs to associated Fmsy and count the number of stocks for which F>Fmsy and the number of stocks for which F ≤ Fmsy 5) Estimate the percentage of stocks for which F ≤ Fmsy Details of the protocol are presented in Annex I of the report mentioned in the reference section.
Reference: Scientific, Technical and Economic Committee for Fisheries (STECF), Monitoring of the performance of the Common Fisheries Policy (STECF-adhoc-23-01) , Publications Office of the European Union, Luxembourg, 2023, doi:10.2760/361698, JRC133325.
Producer: Joint Research Centre
Provider: Eurostat
Validated: True
Peer reviewed: True
Documented: True
Open source: True
Accessible: True
Spatial scope (Member States): False
Spatial scope (EU27): True
Spatial scope (global): False
Accuracy uncertainties: None
Comments: None
Storage: None
Datasets
Tag: ICES
Description: Stock assessment outputs provided by the International Council for the Exploration of the Sea (ICES)
Spatial extent: Northeast Atlantic
Temporal extent: 2003-2021
Date: 12/01/2023
Scale: None
Resolution: None
Format: tabular
Version: 2023
Reference: ICES Stock Assessment Database, Copenhagen, Denmark - International Council for the Exploration of the Sea, (https://standardgraphs.ices.dk) accessed 12 January 2023
Findable: True
Accessible: True
Interoperable: True
Reusable: True
Licence of use: Data from published advice can be downloaded, please refer to ICES Data Policy for full conditions and guidance on citation. When publishing results from the database the minimum citation should include: ICES Stock Assessment Database. Copenhagen, Denmark. ICES. [accessed date]. https://standardgraphs.ices.dk
Access data policy: See guidance published on https://www.ices.dk/data/guidelines-and-policy/Pages/ICES-data-policy.aspx
Tag: GFCM
Description: Stock assessment results (STAR) provided by the General Fisheries Commission for the Mediterranean (GFCM)
Spatial extent: Mediterranean and Black Sea
Temporal extent: 2003-2020
Date: 01/01/2023
Scale: None
Resolution: None
Format: tabular
Version: 2023
Reference:
Findable: True
Accessible: True
Interoperable: True
Reusable: True
Licence of use: No licence provided on the web page
Access data policy: Free access
Tag: STECF
Description: Stock assessment outputs provided by the Scientific, Technical and Economic Committee for Fisheries (STECF)
Spatial extent: EU waters of the Mediterranean and Black Sea
Temporal extent: 2003-2020
Date: 02/12/2023
Scale: None
Resolution: None
Format: tabular
Version: 2023
Reference: Osio, C., Gibin, M., Mannini, A., Villamor, A. and Orio, A., The Mediterranean and Black Sea STECF Stock Assessment Database, EUR 29294 EN, Publications Office of the European Union, Luxembourg, 2018, ISBN 978-92-79-88954-7, doi:10.2760/559579, JRC112485
Findable: True
Accessible: True
Interoperable: True
Reusable: True
Licence of use: The data are made available in the interests of transparency and can be freely used for further analyses provided the source is acknowledged
Access data policy: Free access
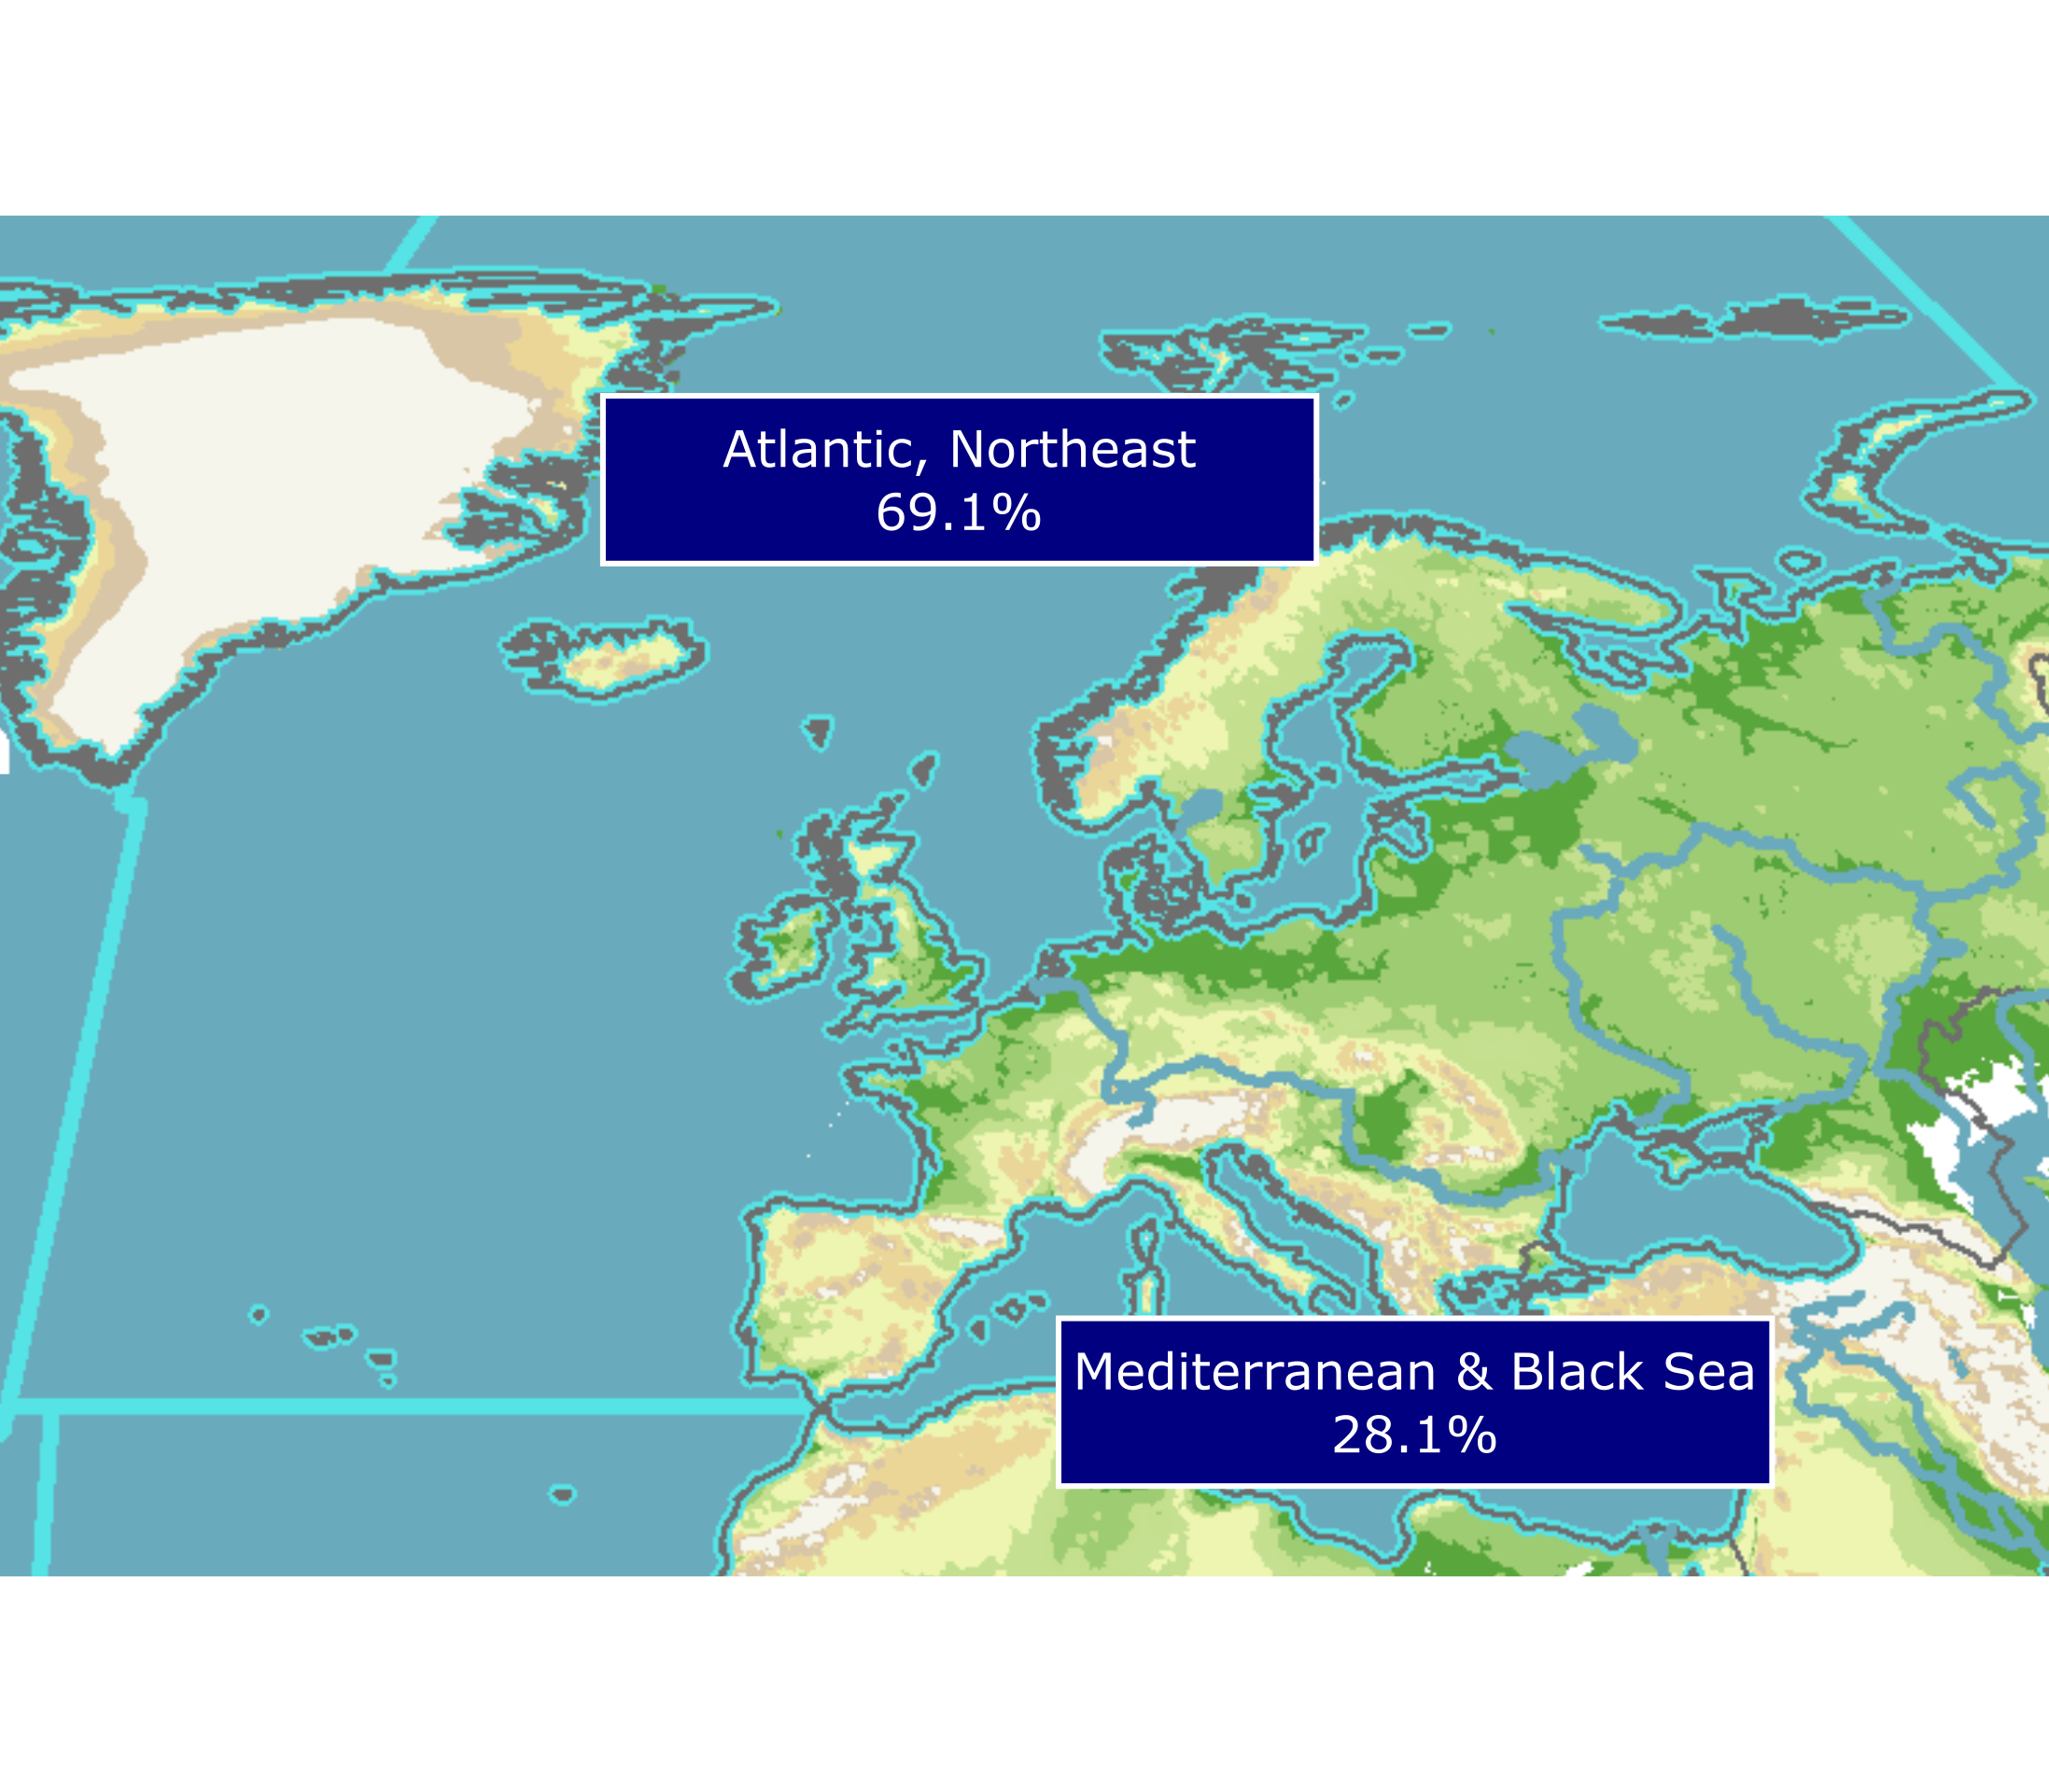
Values
| FAO major fishing area | Value |
|---|---|
| Atlantic, Northeast | 69.1 |
| Mediterranean and Black Sea | 28.1 |
Graphs
Values by FAO major fishing area